Accellum
An IoT operations platform that turns MQTT card and gateway signals into device health, checkpoints, access history, and live dashboards.
Project introduction
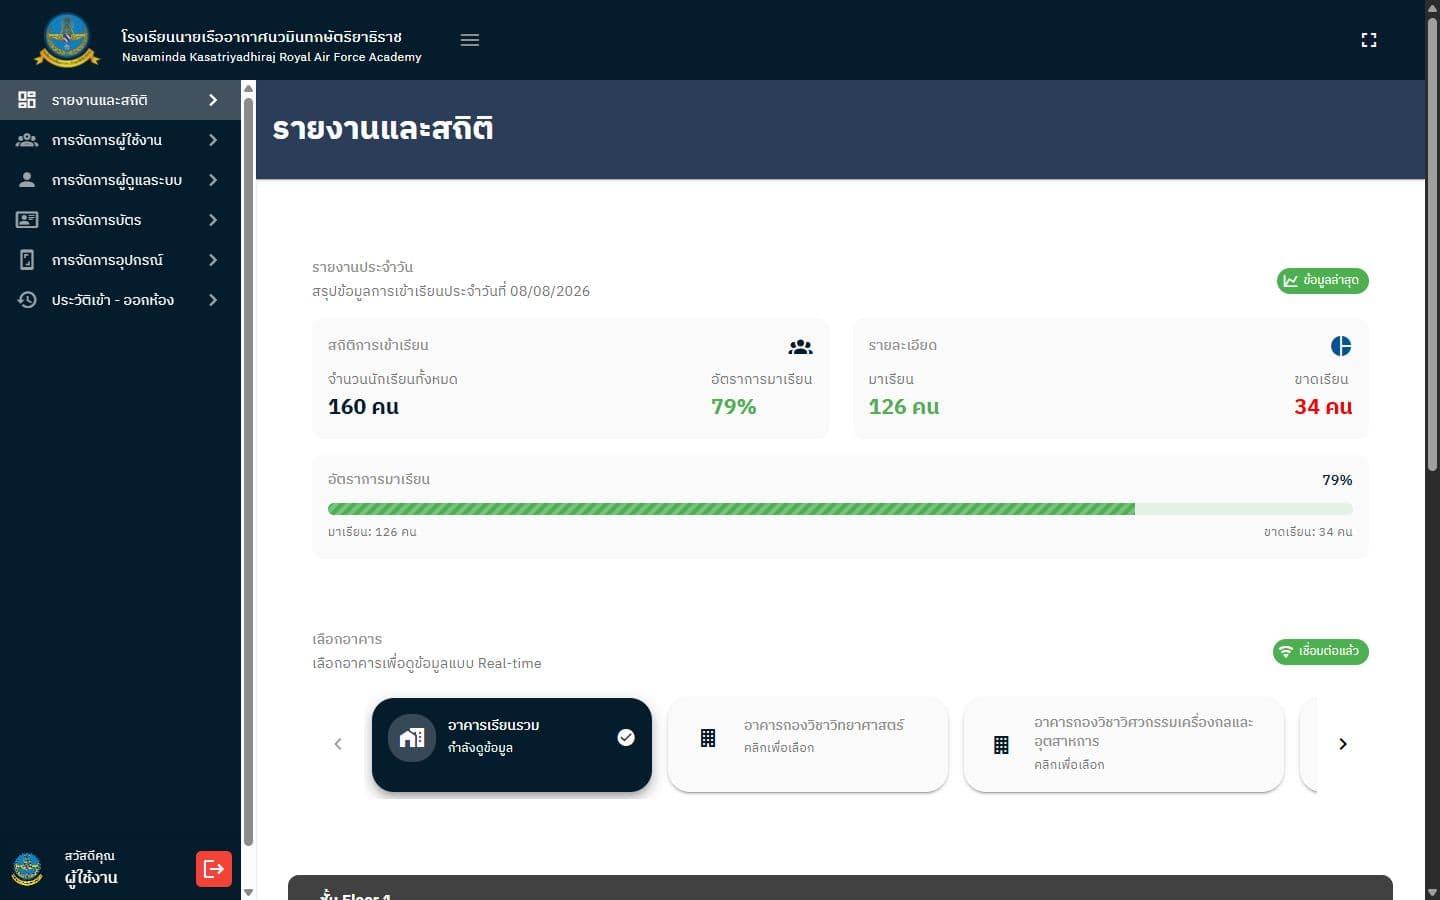
Accellum is an IoT access and attendance operations platform. Bluetooth cards and gateway devices publish signals that are translated into device status, checkpoints, movement, and auditable access history.
What I worked on
- Built MQTT ingestion for device alive, gateway status, and checkpoint topics
- Implemented WebSocket-driven dashboard updates alongside durable PostgreSQL records
- Developed user, card, device, building, access-log, and role-permission workflows
- Added validated Excel import/export for operational data
- Supported TypeORM migrations, Docker services, Mosquitto, and MinIO-compatible storage
Architecture
NestJS subscribers validate MQTT payloads, resolve device and card identities, persist normalized records through TypeORM, and broadcast relevant updates over Socket.IO. The Nuxt/Vuetify admin provides role-aware monitoring and management while historical records remain searchable and exportable.
Outcome
The system turns low-level device traffic into a dashboard administrators can monitor and audit.
How the main product workflows operate
Radio observations become durable room presence and access history
Accellum separates physical detection, event transport, domain rules and operator presentation. MQTT keeps devices independent from request-response APIs, while PostgreSQL and WebSocket serve different durability and immediacy needs.
BLE → gateway → MQTT → NestJS → PostgreSQL / Socket.IO
Socket.IO improves freshness; PostgreSQL remains the auditable source for reports and investigation.
Monitor and checkpoint devices intentionally use different session rules instead of sharing one ambiguous timeout algorithm.
The next two interactive diagrams expose the physical communication path and the exact monitor/checkpoint decision branches.
How a card detection becomes attendance data
The card only broadcasts its identity. The gateway turns that radio observation into an application event; the backend then validates, interprets, stores, and publishes the result to operators.
Two detection modes, two session strategies
Monitor mode models presence from repeated signals and checks out on timeout. Checkpoint mode models an entry/exit session with a five-second debounce and explicit room-transfer handling.